Friday, February 29, 2008

P R O J E C T 2 // development

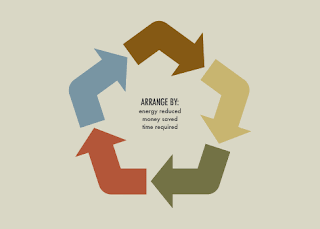
Here is the homepage. From here, the user has the option of arranging the manner in which the steps are ordered by the methods shown. [energy reduced, money saved, time required]


Section of the shape is outlined in black when rolled over to indicate to the user that it is a button.


When a step is selected from the primary navigation, a zoomed in region of the selected segment is shown. The zoom page offers non-linear navigation to other steps through the buttons in the upper left corner. It also offers linear navigation to the next step and the recycle symbol rotates in doing so.


Tuesday, February 26, 2008

W I N D O W T O T H E W O R L D

Here is a device in the making that will completely change the way we access and use information. The device provides numerous learning aids such as a dictionary, thesaurus, reference databases, but most importantly, the ability to recognize objects and locations based on image alone. 

Check it.

Monday, February 25, 2008

P R O J E C T 2 // wireframe

Here are my preliminary sketches from Friday's exercise. The purpose of my five-step instructions is to show people how to reduce the amount of energy they use. Each step will point out the amount of energy saved as well as the difficulty of the task.

here are the sketches...


Friday, February 22, 2008

Sunday, February 17, 2008

P R O C E S S

here is the process for project one thus far...

first collection of statistics...
Photobucket

a simple bar-graph representation of the data...
Photobucket

a much clearer representation of the data...
Photobucket
Photobucket
Photobucket
Photobucket

an attempt to portray quantity through size of percentage...
Photobucket
Photobucket

illustrating the appearance of music related content within ads and articles...
Photobucket

percentages of certain categories scaled accordingly...
Photobucket

furthest development...
Photobucket